
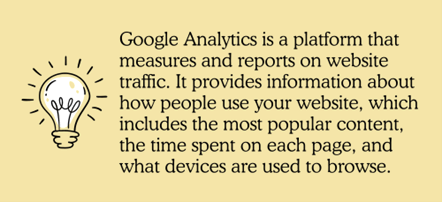
Google Analytics is a tool that helps you understand how people interact with your website. It shows things like which pages get the most visits, how long people stay on each page and what kinds of devices they’re using—like phones or computers. You can also connect it with Google Ads to see which ads bring in the most visitors and turn them into customers. Plus, it gives you helpful details about your audience, like where they’re located and what search terms they used to find your site.

Google Analytics helps website owners easily see how their site is doing. By tracking your website’s performance, you can make smarter marketing choices and boost your chances of turning visitors into customers. But the truth is, many business owners don’t know how to check if their site is working well. To really understand what’s going right—or wrong—you need to look at the data. This data tells you about your customers and how each page on your site is performing. The problem is, some people don’t know how to collect this data and others aren’t sure what to do with it once they have it.
So, what exactly does Google Analytics do and how can it support your business in a competitive market? Keep reading to learn how it can make a difference.
What is Google Analytics?
Google Analytics is a tool that tracks and reports how people use your website. It shows you things like which pages are the most popular, how long visitors stay on each page and what devices they’re using—like phones, tablets or computers. You can also connect it to Google Ads to see which ads bring in the most traffic and turn visitors into customers. On top of that, it gives you helpful details about your audience, like the keywords they searched and where they’re located.
These days, marketing analytics is all about using data. It helps you understand what people do, what they’re looking for and when they’re most likely to act. But if you don’t know how to make sense of that data, it won’t be useful at all.
When you use the right tools to gather and study data from your website, you can spot trends and take action before your competitors do. One of the best tools for this is Google Analytics.
Thousands of businesses already use Google Analytics—and you can as well. But before jumping in, it’s important to understand what kind of information it gives you and why that matters. Once you know that, you’ll be ready to set it up and start using it to your advantage.
Why You Need Google Analytics
Whether you’re running a blog or launching a new business website, it’s important to know what’s working and what isn’t. Google Analytics helps you answer key questions like:
- How many people are visiting your site?
- Where are your visitors located?
- How are they finding your website?
- Which pages do they visit the most?
- How many of them turn into leads or customers?
- What type of content gets the most attention?
- What devices—like phones or computers—are they using?
Google Analytics works smoothly with other marketing tools like Google Ads and Google Data Studio. It brings together data from different sources to give you a clear, detailed picture of your audience. The more you understand your visitors, the easier it becomes to offer them exactly what they’re looking for.
How Does Google Analytics Work?
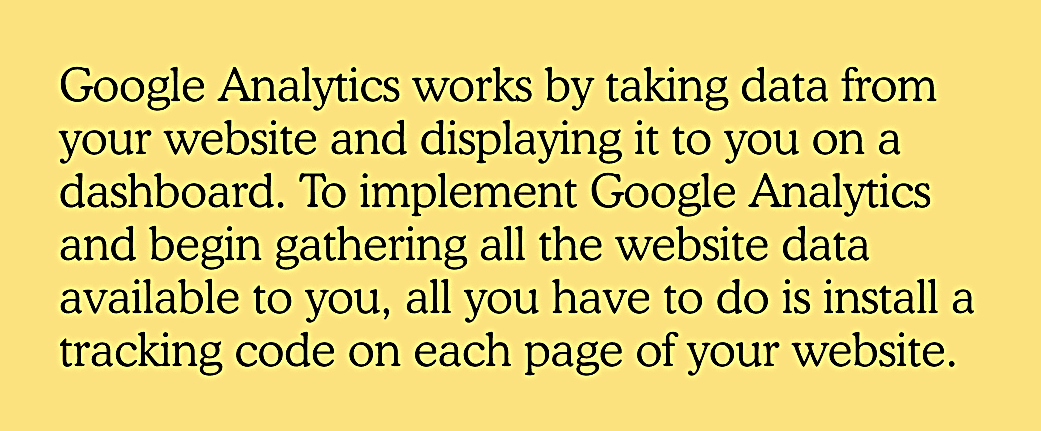
Google Analytics collects data from your website and shows it on a dashboard that’s easy to understand. To start using it, you just need to add a small tracking code to every page on your site. Once that’s done, it begins gathering useful information for you.
The tracking code collects information from a visitor’s web browser and sends it to your Google Analytics dashboard. Once it’s set up, the data starts coming in automatically. You can also customize your setup to track more things—like button clicks—by using tools like Google Tag Manager and other tracking features.
How to Install & Set Up Google Analytics
First, create a Google Analytics account. If you already use a Google account for things like Gmail or YouTube, you can use that to get started.
Make sure the account is in your name—not someone else’s. If it’s tied to another person and they leave your team, you could lose access to all your data. If you want someone else to help manage your Google Analytics, just give them permission without giving them full control.
Step 1 – Add Your Account & Property Details
After signing in with your Google account, go to the Google Analytics website and click on “Sign into Google Analytics” or “Start for free.” Both options will take you to a page where you’ll see a blue button that says “Set up for free.” Click it to start creating your Google Analytics account.
Then, follow these steps:
- Choose if you want to track a website or a mobile app.
- Enter your account name.
- Add the name and URL of your website or the name of the app you want to track.
- (Optional) Pick your industry & time zone.
You can also organize your account using a structure, if you’d like:
- Top Level: Organizations – This helps you manage users, permissions and tool connections.
- Middle Level: User Accounts – Here, you can access Analytics, choose what to track and share data with others.
- Bottom Level: Properties – These are the websites, apps or devices you want to track.
You decide what to track. Keep in mind:
- One Google Analytics account can track up to 50 properties.
- You can have up to 100 Analytics accounts under one Google account.
Each property can have up to 25 views. At the very least, set up two:
- One view that filters out internal company traffic.
- One view that shows all data with no filters.
Make sure you carefully plan which properties go under which account. You can’t transfer a property from one Analytics account to another. If you ever need to, you’ll have to create it again from scratch—and you’ll lose any data that was collected before.
To keep things organized, it’s smart to use clear and simple names for your accounts and properties. Don’t worry—you can always rename them later if needed.
Right below the section where you set up your property, you’ll see options for data-sharing settings. This is where you can choose what types of information you want to share with Google to help them keep the service running smoothly. You can check or uncheck options like:
- Benchmarking
- Tech support
- Google product data
Step 2 – Add Your Tracking Code
After entering your account and property details, follow these steps:
- Click the “Get tracking ID” button.
- A pop-up will show Google’s terms and conditions—agree to continue.
- You’ll then get your Google Analytics tracking code.
This code is a mix of numbers, letters and symbols. You need to copy and paste it onto every page of your website so Google Analytics can start tracking your site activity.
If your website has a lot of pages—like 50 or more—don’t stress. You only need to add the tracking code to your page templates. Once that’s done, you can reuse those templates for as many pages as you want.
How you add your Google Analytics tracking code depends on the website builder or platform you’re using.
- If you have a custom HTML website, open your HTML files with a text editor and paste the tracking code right before the closing </head> tag on each page. After that, save the files and upload them to your server using an FTP program.
- If you’re using WordPress, the Genesis Framework has built-in spots for header and footer scripts where you can easily paste the code. Another option is to use the MonsterInsights plugin which lets you add the tracking code to any WordPress page without touching the code directly.
There are plenty of other ways to add Google Analytics to your website. If you’re using a website builder that isn’t mentioned here, just check the admin or settings menu. Look for a section called “Google Analytics” or “Analytics” to find where you can add your tracking code.
How to Use Google Analytics
After setting up your Google Analytics account, choosing what to track and adding the tracking code to your site, you’re all set to start collecting data. Once you’ve gathered enough info, you can explore the reporting tools to see what’s working and how you can use the data to improve your website and marketing efforts.
Viewing Google Analytics Data
When you sign in to your Google Analytics account, you’ll usually land on the Audience Overview report. If you’re tracking more than one website, you’ll first see a list of your sites. Just click on the one you want and it will take you to that site’s Audience Overview page.
The Audience Overview report shows details about your visitors, like their age, language, device type and operating system. It also gives you useful stats such as how many pages they viewed, how long they stayed and how many were new visitors compared to people who’ve been to your site before.
The data is shown in numbers, tables and visual graphs. If you click on a specific stat, you’ll see a line graph and a pie chart that break down that number, making it easier to understand the details.
Google Analytics offers over 50 different reports. You can find them by clicking on the Reporting tab in the top menu.
Many of the reports in Google Analytics have a similar layout to the Audience Overview report. To get the most out of your data, try using different features and tools:
- Choose a date range to see data for a specific time period.
- Compare stats from two different time periods by selecting dates and checking the “Compare” box.
- Hover your mouse over certain areas to get more details or explanations.
- Switch between reports to see data sorted by things like language, location, device type and more.
- Check out full location reports to see where your users are coming from.
Google Analytics lets you dig deep into almost any detail. You can sort and filter the data to find what you need—or take a closer look at single points, like where a user is located or what screen size they were using when they visited your site.
Spend some time exploring and adjusting your data filters. This will help you figure out which information is most helpful for answering questions like which pages on your site are the most visited and who’s most interested in your content.
Types of Google Analytics Reports
In the Admin menu on the left side, you’ll see a list of reports you can open. Each one gives you insight into a different part of your audience and how they interact with your site.
Audience reports give you detailed info about the people visiting your website or using your app. You can see data like:
- Age & gender
- Where they’re located
- How they behave on your site
- What devices & technology they use
- The languages they speak
You can also set up custom metrics to get an even better understanding of their interests and actions.
Acquisition reports show how people found your website. They break down your traffic by source—like which visitors came from social media, ads, search engines or other websites—so you can see where your audience is coming from.
Behavior reports show how people interact with your content. You’ll find out things like:
- Which pages on your site get the most views
- Which blog posts are the most popular
- How long visitors stay on each page
- How quickly your site loads
You can also customize the report to see more details, like what words people are searching for on your site. This info helps you create smarter marketing campaigns based on what users do while they’re on your site.
Conversion reports are linked to the goals you set in Google Analytics. They show how well your website is meeting those goals—for example, how many people are taking actions like signing up, making a purchase or filling out a form.
Conversion reports work together with other Google Analytics reports. For example, you can use audience data to filter conversions by location or language. This is really helpful if you have different marketing strategies for different groups of people. It’s also great for A/B testing because it lets you compare how different versions of your pages are performing.
Adding Report Shortcuts
In the beginning, it’s a good idea to explore all the reports Google Analytics provides. But over time, you’ll notice that certain reports are more helpful to you than others.
To make things easier, Google lets you save shortcuts to the reports you use the most. Just click the Shortcuts link at the top of any report you want to save. After that, it will appear in the shortcuts menu on the sidebar for quick access.
You can also set up reports to be automatically emailed to you or your team. Just click the Email button at the top of the report, choose how often you want it sent, pick the day of the week, add the email addresses and click Send.
How to Add More Accounts & Properties
To create a new Google Analytics account:
- Go to the Admin tab
- In the Account drop-down menu, click Create new account
- Enter the required account details
To add a new property to an existing account:
- In the Property drop-down menu, click Create new property
- Fill in the needed information for that property
Top Metrics to Track
As mentioned earlier, Google Analytics gives you data in the form of metrics. But what exactly is a metric? In simple terms, it’s a number that shows how your website is performing. These numbers—whether they’re percentages or totals—help you understand how people use your site. Here are some of the most important metrics every website owner should keep an eye on:
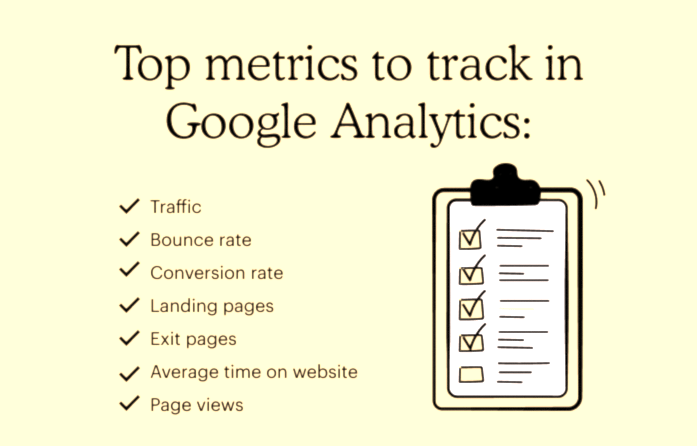
Traffic
Traffic is the total number of people who visit your website. In Google Analytics, traffic is measured in two ways: sessions and users.
- Sessions show how many total visits your site gets.
- Users show how many individual people visited.
One person (user) can visit your site multiple times which means they can create several sessions—but each session still belongs to that same user.
Bounce Rate
Bounce rate shows the percentage of visits where someone looked at just one page on your site and then left. This number can be different for each page, so it’s not always helpful to judge your whole website by it. Instead, check the bounce rate for individual pages to see if people are moving through your site the way you planned. Some pages—like blog posts—often have a higher bounce rate than product or service pages and that’s completely normal.
Conversion Rate
The conversion rate shows the percentage of visitors who took a specific action on your site. This could be anything from buying a product to filling out a sign-up form, depending on the goals you’ve set for your website.
Landing Pages
Landing pages show you which pages people first arrive on when they visit your website from outside sources, like search engines or referral links. Tracking these pages is important because they can give you insight into why some of your content isn’t leading to conversions.
Exit Pages
Exit pages show you which pages people are on when they leave your website. If you see that a lot of visitors are leaving from pages that should lead to the next step, it’s a sign something might be off. You can review those pages to find out what’s going wrong and think about how to improve them.
Average Time on Website
The amount of time someone spends on your site can say a lot about how engaging your content is. If visitors are staying longer, it usually means they’re interested and finding value. You can also check how long people stay on specific pages to see which ones are getting the most attention. This helps you figure out if you’re reaching the right audience.
Page Views
Page views show how many pages a visitor looks at before leaving your site. If your website is big and you want people to explore several pages, you should see a higher page view count. If the number is low, you can check how many views each page is getting. This helps you see what kind of content your audience enjoys most, so you can create more of what works.
Custom Settings to Get the Most from Your Data
Sometimes, the basic tracking and reports in Google Analytics aren’t enough to answer all your questions. Luckily, there are built-in tools and options—like custom metrics and goals—that let you tailor the data to better fit your business needs.
How to Set Up Goals
After setting up your profile and adding the tracking code, the next step is to create goals. Goals help you track specific actions people take on your site—like signing up or making a purchase—so you can see how well your pages are performing. To set this up, go to the Admin tab at the top of your Google Analytics page, then click Goals under the View column for your website.
When setting up a goal in Google Analytics, you’ll see ready-made templates grouped into categories like:
- Revenue
- Acquisition
- Inquiry
- Engagement
Each category gives you different goal options. For example, under Revenue, you can choose goals like:
- Buying tickets
- Creating an account
- Purchasing products
- Making a donation
After picking a template, you’ll be asked to fill in the goal’s name, type and other details. In the details section, you can set up a funnel, which tracks the steps people take to reach your goal. For example, if you want to track purchases, you can add the URLs of each page in your checkout process. Google Analytics will then show you how many people move through each step—and how many drop off before finishing.
You can also create your own custom goals in Google Analytics. Here’s how:
- Click the New Goal
- Choose the Custom option and click Next step.
- Give your goal a clear name, like “Landing page hits,” then click Next step
- In the Destination box, type the part of your landing page URL that comes after “.com” where it says “Begins with.”
- If needed, you can also add a dollar value and mark the stage in your sales funnel—this is helpful if you’re tracking leads or conversions.
- Click Create Goal to save it.
You can set up to 20 goals per website, so think about what really matters to your business. Goals help you see how well your pages are doing and whether your marketing or content strategy is working.
How to Set Up Site Search
If your website has a search box, it can give you useful insights into what visitors are looking for. Google Analytics can track these searches to help you understand what your audience really wants when they visit your site.
To turn on Site Search in Google Analytics, follow these steps:
- Do a search on your website and keep that browser tab open—you’ll need the URL
- Go to the Admin section in your Google Analytics account.
- Under the View column, click View Settings
- Scroll down to Site Search Settings and switch the toggle to On
- In the Query parameter box, enter the letter that shows up in your search URL—usually something like “s” or “q” (for example, “s=shoes” or “q=blog”)
- Click Save
Once this is set up, Google Analytics will start tracking all searches made on your site. This info helps you see what visitors are looking for most, so you can create more of the content they actually want. If you run a blog, for example, you can use this data to write posts about the most searched topics.
Google Analytics FAQs
Now that you’ve learned the basics of Google Analytics, you might still have a few questions. Here’s one that comes up often:
How do I share my Google Analytics data with others?
To let someone else view your Google Analytics data:
- Go to the Admin
- Under the account or property you want to share, click User Management.
- Enter the email address of the person you want to share access with.
- Choose the level of permission you want them to have.
You don’t need to give them access to your full Google account—just to your Analytics data.
Can I Get a Summary of My Google Analytics Data?
Yes! There are ways to make your Google Analytics data easier to understand.
One built-in option is to get monthly summaries by email. Here’s how to set it up:
- Sign in to your Google Analytics account.
- Click on Admin.
- Go to User Settings.
- Check the box next to “Performance suggestions and updates.” (Uncheck it if you ever want to stop the emails.)
Once this is done, Google will send you a monthly email with a quick summary of your website’s performance for the previous month.
Why Does Google Analytics Show Keywords as “(not provided)”?
If you see something like “90%+ of organic keywords are (not provided),” it means Google is hiding those keyword details to protect user privacy. So, the specific search terms people used aren’t shown in your reports.
While you can’t see all the keywords, there are tools that can help you get some insights, such as:
- Google Search Console
- AuthorityLabs
These tools might not show everything but they can still help you understand general search trends and what people might be looking for.
Put Google Analytics to Work for You
Google Analytics is a powerful tool that helps you improve your marketing and content strategies. The more you use it, the better you’ll understand what data matters most and which trends to watch. Over time, you’ll gain valuable insights about your audience and website, helping you make smarter decisions to grow your business.
Once you’ve reviewed your website data, you can start coming up with ideas and plans to improve your digital marketing using real insights. After that, you can easily update your website using Sid Web Solutions’ website builder, which lets you drag and drop different elements into your design. This makes it simple to improve user experience and test out new ways to make your site easier to use.
Take your business to the next level